

Reasonable is a fiduciary duty — not a guess.
ERISA requires plan fiduciaries to ensure the fees a plan pays are reasonable for the services received. Without a benchmark, "reasonable" is an opinion — and an exposure. A documented comparison turns it into evidence.
We benchmark your plan against comparable plans — matched on average balance and participant count — and score fees, features, and outcomes by quartile. You see exactly where the plan stands, what a better arrangement looks like, and a record that the review was done.
Every cost the plan actually pays.
What you pay for investment advice and fiduciary services, expressed in basis points and dollars.
Recordkeeper and TPA costs — including revenue sharing that can hide the true price.
The weighted expense ratio of the fund lineup, and whether lower-cost share classes are available.
The services and functionality the plan receives for its fees — not just the price in isolation.
Participation, deferral rates, and engagement, so cost is judged against the value delivered.
Where does your plan land?
We place each cost against comparable plans, so "reasonable" becomes a position you can point to — and defend.
What lands on your desk.
A benchmark is only useful if the committee can read it. These are pages from a real proposal, anonymized — the same format you'd receive.
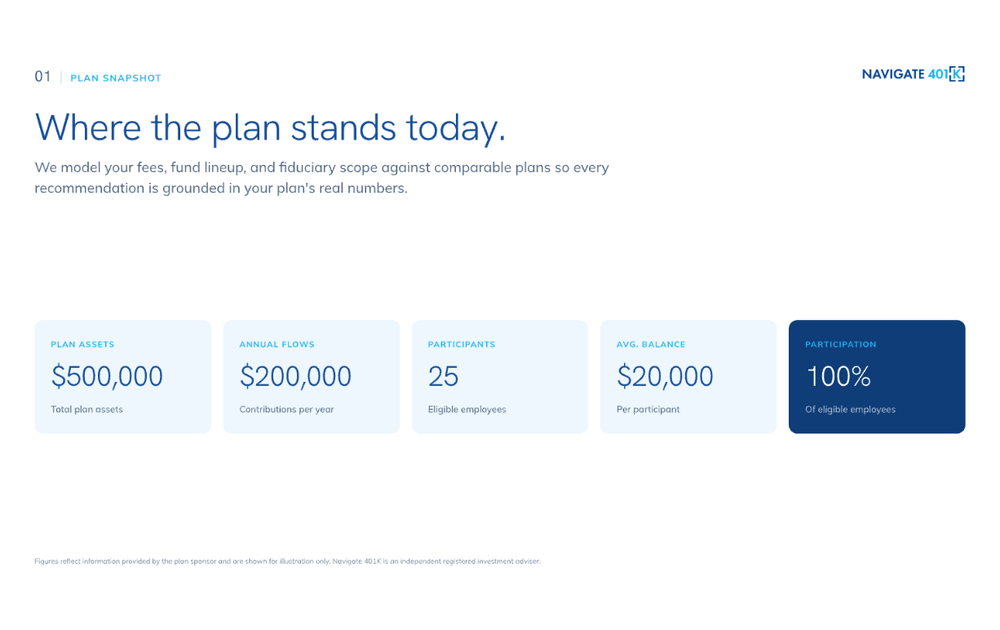
Assets, participant count, average balance, and the plan's current all-in cost — taken straight from your disclosures before any comparison is made.
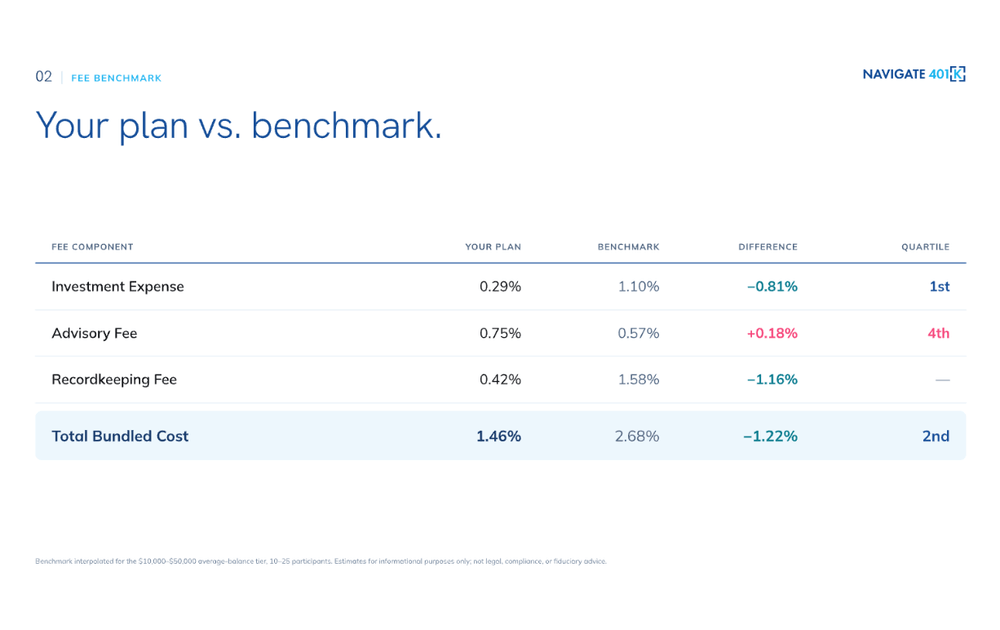
Investment expense, advisory fee, and recordkeeping shown against the benchmark for your size band — with the difference and the quartile, not just a total.
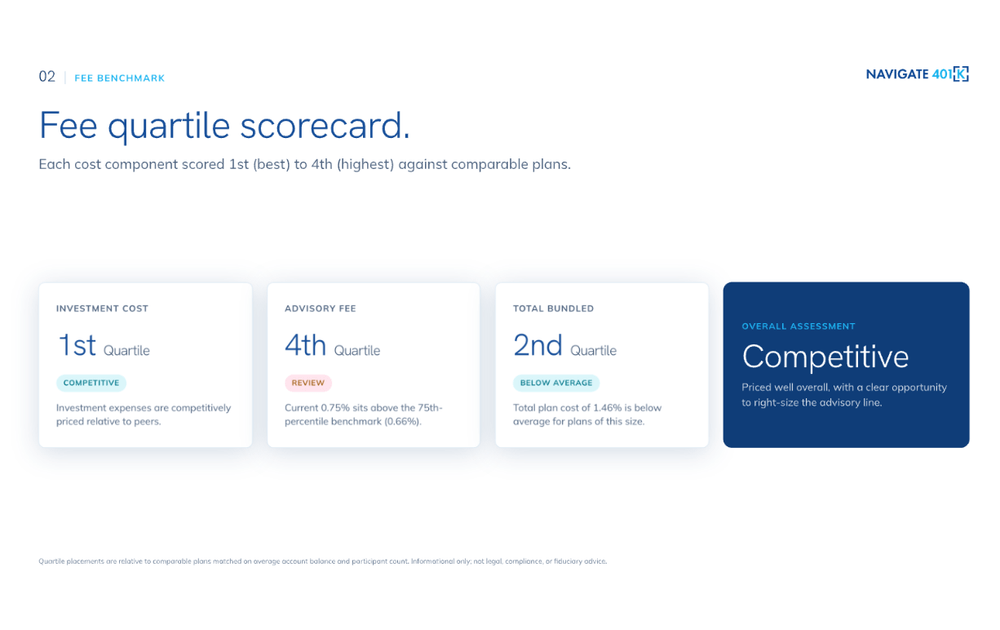
Each component gets a quartile placement against comparable plans, so "reasonable" becomes a position the committee can point to — including where the plan looks expensive.
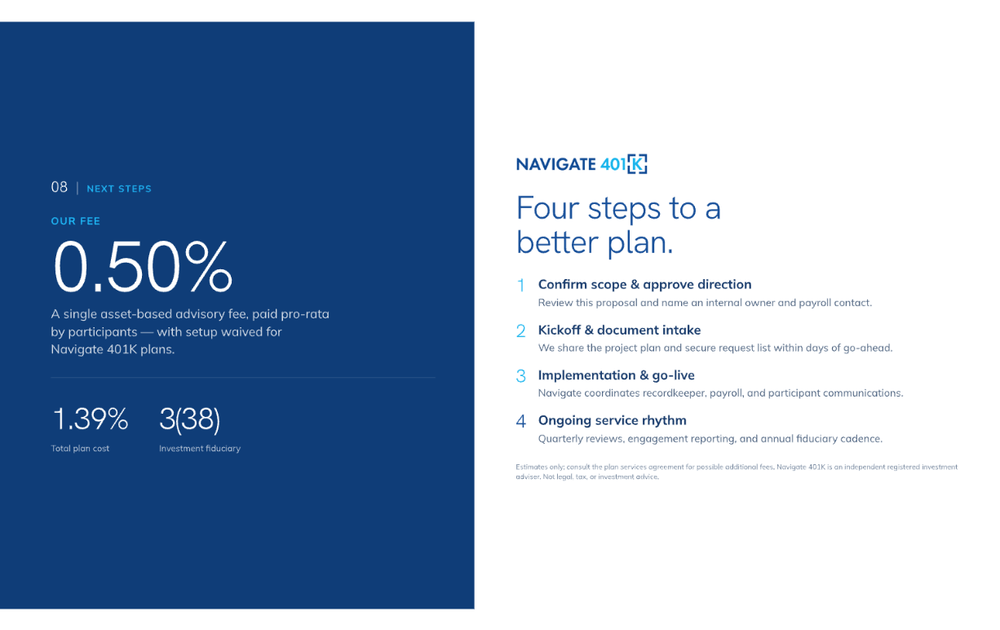
What we'd change, what it costs, and the fiduciary scope attached — ending in a short list of decisions rather than an open-ended report.
Sample proposal pages, shown for illustrative purposes only. All figures are from an anonymized example — pricing, benchmark data, and quartile results vary by plan assets, participant count, provider, and service scope. Nothing here is a quote, an offer, or a projection of what your plan would pay.
From disclosures to a documented result.
A record — and often, real savings.
A written benchmark that evidences your fiduciary process — the record examiners and courts look for.
A quartile position for each cost, so you know exactly where the plan is competitive and where it isn’t.
Where fees run high, a concrete path to lower them — better share classes, renegotiation, or a provider change.
Benchmarking on a regular schedule, so reasonableness is proven continuously, not once.
Questions sponsors ask.
Find out where your fees stand.
Send us your fee disclosures and we'll benchmark the plan — no obligation, and you keep the documented result either way.